
Fabric RTI 101: AI Anomaly Detection - How it works

The workflow is straightforward once you know the moving parts. You begin in your Eventhouse - that’s where data from your event streams is stored.
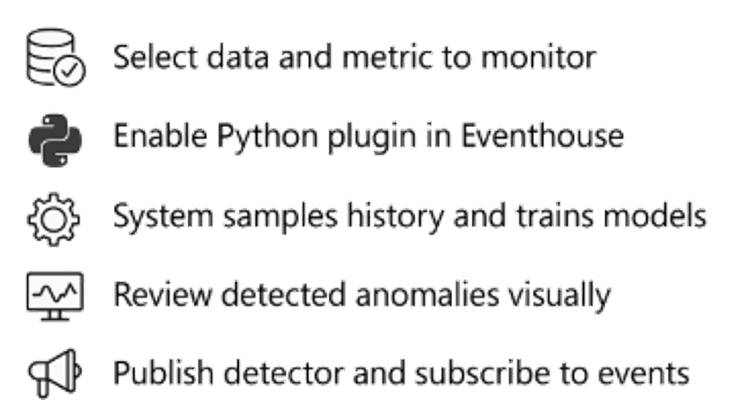
First, ensure that the Python plugin is enabled. This plugin provides the AI runtime used to train and run anomaly models. It can take up to an hour to enable for the first time, so plan that in advance.
Next, you select the dataset or table to analyse and identify the metric to monitor - for instance, CPU utilization, response time, or sensor readings. You also specify a timestamp column and any grouping keys - maybe a device ID, region, or customer.
Fabric then takes a historical sample of the data, analyses its shape, periodicity, and trends, and tests multiple models automatically. This model selection process can take anywhere from a few minutes to half an hour, depending on the amount of history.
Once it’s done, you’ll see an evaluation panel. Here, detected anomalies are plotted over time, alongside the predicted baseline. You can inspect where each anomaly occurred, compare against normal ranges, and adjust the sensitivity level if needed. You can also see which models Fabric tried and which one it chose as the best fit.
When you’re satisfied, you publish the detector. From that point on, the system runs continuously in the background, checking new incoming data against the trained model.
Detected anomalies appear instantly in the Real-Time Hub. You can subscribe to those events - for example, to trigger alerts, update dashboards, or feed downstream automations.
The setup is one-time: configure, review, publish, and then monitor results as the data continues to flow.
Learn more about Fabric RTI
If you really want to learn about RTI right now, we have an online on-demand course that you can enrol in, right now. You’ll find it at Mastering Microsoft Fabric Real-Time Intelligence
2026-09-26