
Fabric RTI 101: Creating Power BI Reports on Real-Time Data

In the past, if you wanted a real-time Power BI dashboard, you had to use streaming datasets — data pushed directly into Power BI from an external source.
While that approach worked, it came with significant limitations: the data couldn’t easily be joined with historical information, retention was limited, and managing the push model was complex.
That model is now deprecated — streaming datasets shouldn’t be used for new solutions.
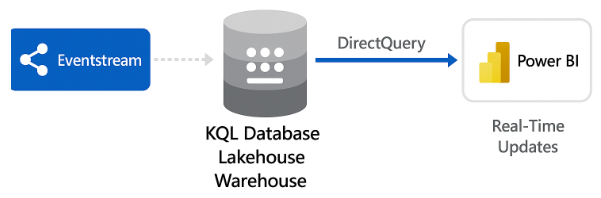
The modern approach is to use Fabric Real-Time Intelligence (RTI) with Eventstreams as the ingestion layer. Eventstreams capture and route real-time data, landing it in destinations like a KQL Database, Warehouse, or Lakehouse.
From there, Power BI connects through DirectQuery, enabling near real-time visuals that refresh automatically as new data arrives.
This design offers the best of both worlds — you get low-latency operational visibility, but your dashboards are built on fully queryable, persisted data. That means you can seamlessly combine live telemetry with historical context — for example, comparing this hour’s traffic volume to the same hour last week, or visualizing anomalies against long-term trends.
Updates happen automatically — there’s no need for special streaming visuals or a separate dataset type. Everything is unified under the Fabric platform.
In practice, this shift makes Power BI dashboards more powerful and maintainable. They’re backed by real storage, easily secured and governed, and they scale naturally with the rest of your Fabric environment.
So when you’re building real-time reports today, don’t think of it as streaming into Power BI, but as streaming into Fabric, and then visualizing through Power BI — all within a single, integrated ecosystem.
Learn more about Fabric RTI
If you really want to learn about RTI right now, we have an online on-demand course that you can enrol in, right now. You’ll find it at Mastering Microsoft Fabric Real-Time Intelligence
2026-07-10