
SSMS Tips and Tricks 4-11: Encryption status in query status bar
One of the bigger changes in recent versions of SSMS has been the inclusion of connection encryption details on the main connection page:
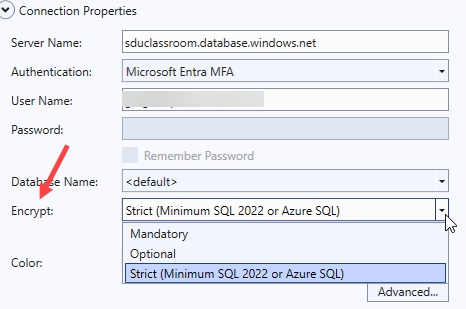
Previously, this was on another page of the logon dialog. Once you make the connection though, there previously was no indication of what type of encryption was used. Now that appears in the query status bar as a lock. When you hover over the lock, it shows you the type of encryption that had been selected.
2025-11-04