
Fabric RTI 101: Using Fabric Maps with Real-Time Intelligence
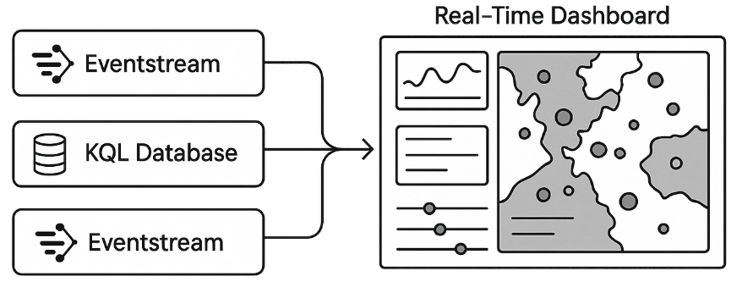
Fabric Maps allow you to visualize spatial data as it changes in real time. When integrated with Real-Time Intelligence, you can stream live data directly from Eventstreams or query current states from KQL databases.
Each map layer can represent different metrics — such as sensor status, delivery vehicle locations, or regional anomalies — updated continuously as new events arrive.
You can also apply time slicers and filters to replay historical activity, helping to analyze event sequences over time.
Maps are especially powerful for IoT, logistics, and operations dashboards, where seeing the live spatial context provides instant insight into what’s happening and where.
This makes them an excellent complement to Power BI visuals and other Fabric real-time dashboards.
Learn more about Fabric RTI
If you really want to learn about RTI right now, we have an online on-demand course that you can enrol in, right now. You’ll find it at Mastering Microsoft Fabric Real-Time Intelligence
2026-07-14