
Fabric RTI 101: Thresholds

In real-time analytics, thresholds are the simplest way to detect when something goes outside of normal operating conditions.
A threshold is just a fixed value or condition applied to a metric. For example, you might set a rule to flag when CPU usage stays above 90% for more than five minutes, or when transaction latency exceeds two seconds.
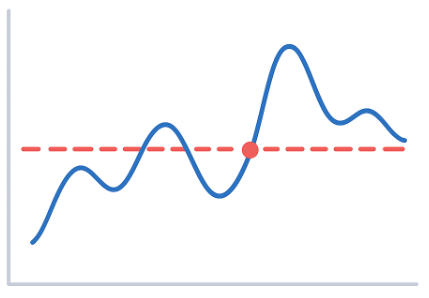
In Fabric Real-Time Intelligence, thresholds are typically implemented within KQL queries or dashboard visuals — for instance, using conditional formatting to highlight values above a certain limit, or defining an analytic rule to monitor a KPI in real time.
They’re easy to understand and quick to configure, which is why thresholds are so widely used in operational monitoring.
Thresholds work best when you’re dealing with well-understood metrics — things where you already know what “too high” or “too low” looks like. For example, system performance counters, network latency, or error rates in APIs.
The limitation, of course, is that fixed thresholds don’t adapt — what’s normal at 2 a.m. might not be normal at 2 p.m. That’s why, later in the module, we’ll look at anomalies, which detect unusual behavior dynamically rather than relying on fixed cutoffs.
And when we discuss Activator in future posts, you’ll see how these thresholds can feed directly into triggers and workflows — turning simple conditions into automated actions.
Think of thresholds as the starting point for real-time alerting: simple, transparent, and effective for quick wins.
Learn more about Fabric RTI
If you really want to learn about RTI right now, we have an online on-demand course that you can enrol in, right now. You’ll find it at Mastering Microsoft Fabric Real-Time Intelligence
2026-07-06