
Fabric RTI 101: KQL Aggregations
When you’re dealing with real-time or high-volume event data, one of the first challenges is scale — there’s simply too much information to interpret at the individual event level. That’s where aggregations come in. Aggregations are the process of summarizing large numbers of rows into meaningful metrics that humans can easily interpret.
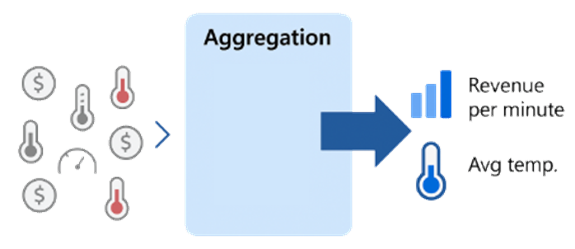
For example, if you’re collecting IoT sensor readings from thousands of devices, it doesn’t make sense to inspect each data point individually. Instead, you might calculate the average temperature per minute, the total number of readings received, or the maximum pressure recorded in the last hour. Those aggregated values turn a flood of raw data into something you can analyze and act on.
KQL provides a range of aggregate functions for this purpose. The most common ones are:
count() – for counting the number of events in a time window or group
avg() – for calculating averages
min() and max() – for identifying boundary values.
You’ll also often see sum(), stdev(), or percentile-based functions in more advanced analyses.
In real-time scenarios, we often perform time-based aggregations, sometimes referred to as time-window aggregations. Instead of aggregating all data ever collected, you define windows such as per minute, per five minutes, or per hour. This gives you rolling or incremental insights — for example, average response time per minute, or error rate per hour.
These time windows are what make trend detection possible. They allow you to visualize how your metrics change over time and to spot deviations or anomalies.
It’s also worth noting that aggregations are central to dashboards and monitoring systems. Most of the metrics you see on a dashboard — things like requests per second, average CPU usage, or number of failed transactions — are just different types of aggregations.
Behind the scenes, those values are computed continuously from incoming data streams and then refreshed in near real time.
Aggregations aren’t only about reducing volume; they’re about shaping the data into decision-ready information. They help you see patterns that individual events can’t reveal — for instance, a gradual increase in latency, a sudden drop in throughput, or consistent fluctuations that might signal instability.
Aggregations are how we transform raw, high-volume data into clear metrics that reveal system health and performance.
They’re the foundation of trend analysis, alerting, and real-time dashboards — without them, the data would be too detailed to interpret meaningfully.
Learn more about Fabric RTI
If you really want to learn about RTI right now, we have an online on-demand course that you can enrol in, right now. You’ll find it at Mastering Microsoft Fabric Real-Time Intelligence
2026-06-16