
Power BI: Creating a TopoJSON file of Australian postcodes for use with Shape Map
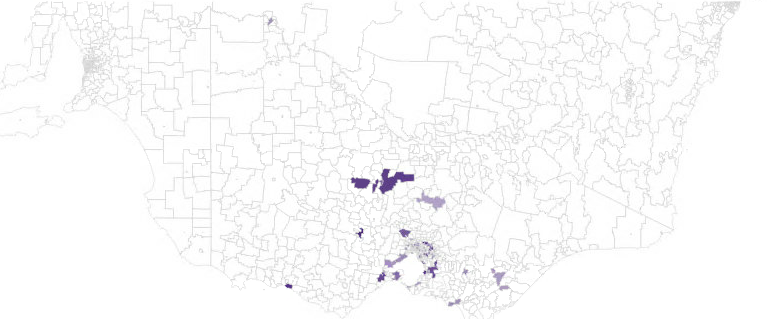
In a recent consulting project, I needed to plot analytic values over postcodes. I couldn’t just do it with the built-in maps control, mostly because the system that we’re developing on doesn’t have Internet connectivity. I was keen to upload the mapping data directly into the report, and the Shape Map control (while still in preview) seemed to fit what I needed exactly.
However, when you load custom maps into the control, they need to be in TopoJSON format. Now TopoJSON is a specific extension over GeoJSON which has been pretty common for a while. I tried just using a GeoJSON file with the control, to no luck.
What was successful was to download the postcode shapes from abs.gov.au under AUSSTATS.
I downloaded the 2011 shape file for Australian postcode areas.
Next I used the website at https://mapshaper.org/ to do the following:
- Loaded the shape file
- Simplified the shape file (I reduced it to about 2% of the original size, while opting to keep any small areas)
- Export the data as a TopoJSON file
- (Optional) I then edited the TopoJSON file to rename my postcode column from POA_CODE to Postcode and from POA_NAME to PostcodeName.
What an awesome site mapshaper.org is !
Notes on Shape Map
To use the shape map control, you need to do this:
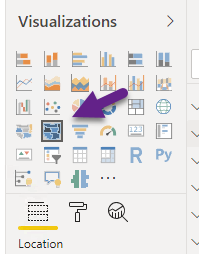
- Make sure you have the Shape Map control (it’s currently a preview feature that needs to be enabled)
- Drag the column containing the postcode to the Location field.
- Once you’ve done that, on the format page, you can choose to add a custom map. I imported my TopoJSON postcodes file
- Drag the analytic value to the Color saturation field.
- Set the background color and border color.
When I first did this, nothing worked for me. Eventually I worked out that my source data had integer postcodes but the ones in the file were just text fields. I added a computed column to my data, made sure I had text postcodes available, and used that column, then all was good.
I hope this helps someone.
2019-11-05