
Fabric RTI 101: Triggering Teams, Emails, and Workflows from Activator
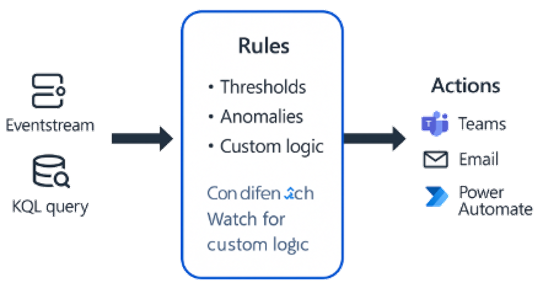
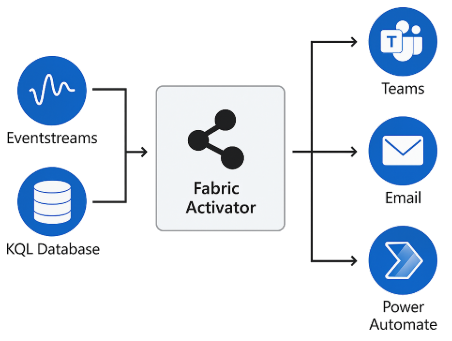
While Activator supports many types of actions, some of the most common and useful ones are notifications — such as sending a message to Microsoft Teams, generating an email, or updating an existing workflow.
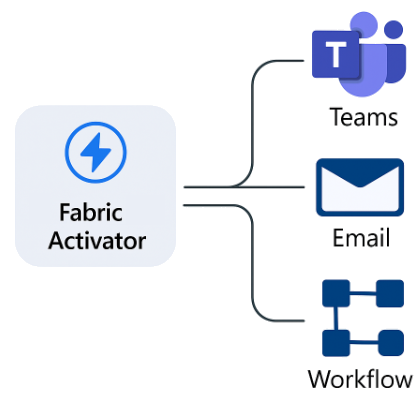
These actions help keep people in the loop. Even when automation is in place, there are times when human awareness or approval is still essential. For example, sending an alert to a Teams channel can immediately notify support engineers that something unusual has happened, while still allowing automated responses to continue in parallel.
2026-08-01