Fabric RTI 101: IoT Telemetry Dashboard Example
IoT environments typically involve large numbers of devices — sensors, controllers, and machinery — each continuously generating telemetry data. Common examples include temperature, vibration, pressure, voltage, and power consumption readings. These data streams provide valuable insight into device health and operating conditions.
Problem to solve
When a component starts to degrade or operate outside normal ranges, early signs often appear in the telemetry before a full failure occurs.
The challenge is that traditional reporting systems tend to work on batch cycles — for example, generating summaries every hour or day. That delay means early warning signs can be missed, especially in high-frequency data streams where conditions can change in seconds.
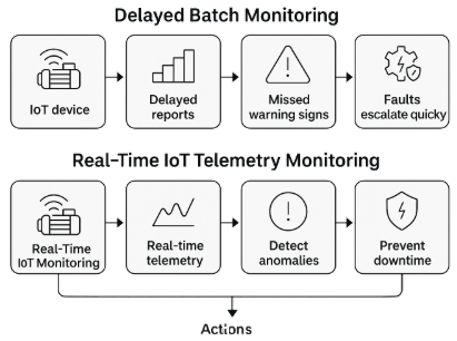
The business requirement is to establish real-time visibility into device behavior, enabling rapid detection of anomalies and timely alerts. This allows operators or automated systems to take corrective action — such as reducing load, scheduling maintenance, or shutting down a faulty unit — before a fault escalates into downtime or safety issues.
The goal is proactive maintenance and fault prevention, achieved by analyzing live telemetry as it arrives rather than waiting for reports after the fact.
Solution Architecture
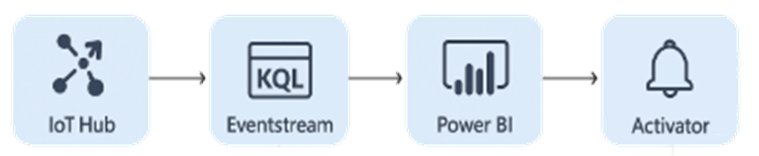
This architecture outlines how Fabric components can be combined to deliver real-time monitoring for IoT telemetry.
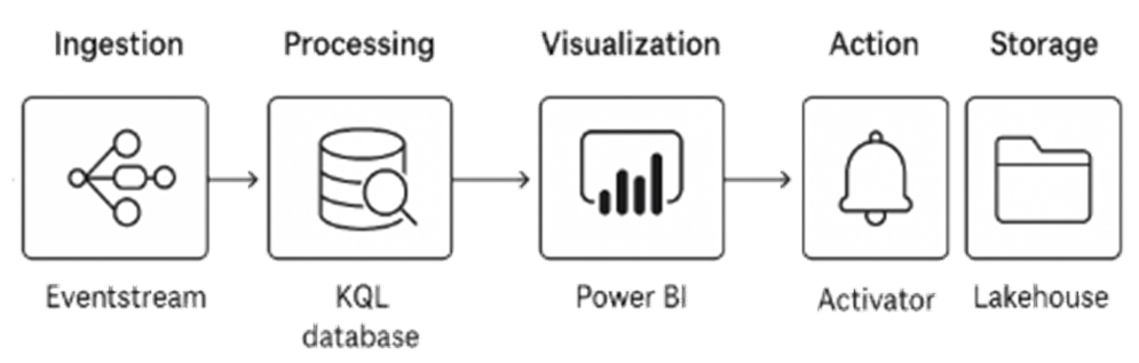
It begins with ingestion, where data from IoT devices — typically routed through Azure IoT Hub — is streamed into a Fabric Eventstream. The Eventstream provides a managed entry point for large volumes of continuous telemetry, handling events such as temperature, vibration, or energy readings as they arrive.
Next comes processing in a KQL database. Here, telemetry is filtered, binned into time intervals, and aggregated for monitoring trends and detecting anomalies. For instance, the pipeline might calculate rolling averages, detect outliers, or classify sensor readings by device or location.
The visualization layer uses Power BI connected to the KQL database through DirectQuery. This allows dashboards to update automatically as new telemetry arrives, without manual refreshes. Operators can observe device health, performance trends, and anomaly events in near real time.
For action, Fabric Activator continuously monitors the output of the KQL queries. When it detects a rule condition — such as a temperature exceeding a safe range or a vibration pattern deviating from normal — it can trigger alerts or workflows. These actions might include sending notifications to Teams, logging an incident, or invoking a maintenance API. Finally, storage is handled by persisting telemetry into a Fabric Lakehouse. This allows historical analysis, correlation across longer timeframes, and model training for predictive maintenance scenarios. The Lakehouse serves as the foundation for trend analysis and capacity planning.
Implementation Notes
The implementation steps for this IoT telemetry monitoring solution are straightforward and build on existing Fabric components.
The process starts by streaming data from IoT Hub into an Eventstream. Each message sent from the device — containing metrics such as temperature, vibration, or pressure — flows directly into the Eventstream, providing a reliable path for continuous telemetry ingestion.
Within the KQL database, data can be summarized using the summarize operator together with bin() to group readings into consistent time intervals, such as one-minute or five-minute buckets. This produces manageable aggregates that reflect trends and support efficient anomaly analysis.
Anomaly detection functions within KQL can then identify sensor drift, sudden spikes, or readings outside expected operating ranges. These signals help detect early indicators of equipment malfunction or calibration issues.
A Power BI dashboard can be created using DirectQuery mode, connecting directly to the KQL database so that dashboards remain up to date as new telemetry arrives. This dashboard typically includes key performance indicators (KPIs) per device — such as average temperature, vibration variance, uptime, or alert counts — giving operators real-time visibility into device health.
Finally, Activator is configured to monitor telemetry streams or query outputs for defined thresholds or anomalies. When conditions are met, it automatically triggers a notification or workflow — for instance, sending a Teams or email alert to maintenance staff or invoking a process to adjust the device configuration.
Together, these elements form a complete loop: data collection, analysis, visualization, and automated response — all operating continuously in real time.
Learn more about Fabric RTI
If you really want to learn about RTI right now, we have an online on-demand course that you can enrol in, right now. You’ll find it at Mastering Microsoft Fabric Real-Time Intelligence
2026-08-31