
Fabric RTI 101: Anomalies

Thresholds are great for simple conditions — but they fall short when what’s normal changes throughout the day, week, or season. That’s where anomaly detection comes in.
Instead of relying on fixed limits, anomaly detection uses statistical and machine learning techniques to model what’s normal for a given signal, then flag data points that deviate from that pattern.
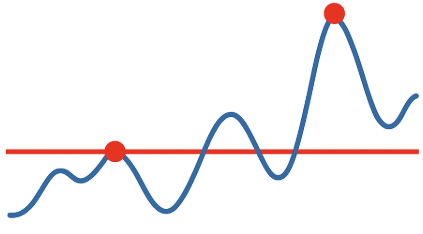
For example, network traffic might be high during business hours but low overnight — a single static threshold would either miss issues or trigger constant false alarms. Anomaly detection adjusts dynamically, recognizing these natural variations in the data.
In Microsoft Fabric, anomaly detection is built right into the KQL query language. You can use functions such as series_decompose_anomalies() to automatically identify outliers in time-series data. These functions can analyze historical trends, detect spikes or drops, and even output an additional column indicating whether each value is normal or anomalous.
Anomaly detection is especially powerful in domains like fraud detection, IoT sensor monitoring, and security log analysis, where patterns are complex and unpredictable.
You can visualize anomalies directly in Fabric Real-Time Dashboards or Power BI, highlighting them with color or markers for quick recognition.
So while thresholds are rule-based, anomaly detection is pattern-based. It helps you monitor systems where normal behavior isn’t static — turning noisy, unpredictable data into clear, actionable insights.
Learn more about Fabric RTI
If you really want to learn about RTI right now, we have an online on-demand course that you can enrol in, right now. You’ll find it at Mastering Microsoft Fabric Real-Time Intelligence
2026-07-08