
Fabric RTI 101: What is Processing?
Once events have been ingested, the next step is processing. This is where we take the raw firehose of events and turn it into something meaningful and usable.
NOTE: We’re not talking about storing the events in a database, and then querying them. We can do that, but here we’re talking about transforming the events in-flight. It’s similar to what we could do with Azure Stream Analytics. I like the description that says that instead of throwing a query at the data, you’re throwing the data at a query.
The raw event stream is often messy. It might include lots of noise — events that aren’t useful for your business questions. Processing is about transforming and filtering those streams. Maybe you only care about certain types of transactions, or events above a certain threshold. Filtering allows you to reduce the noise and focus only on what matters.
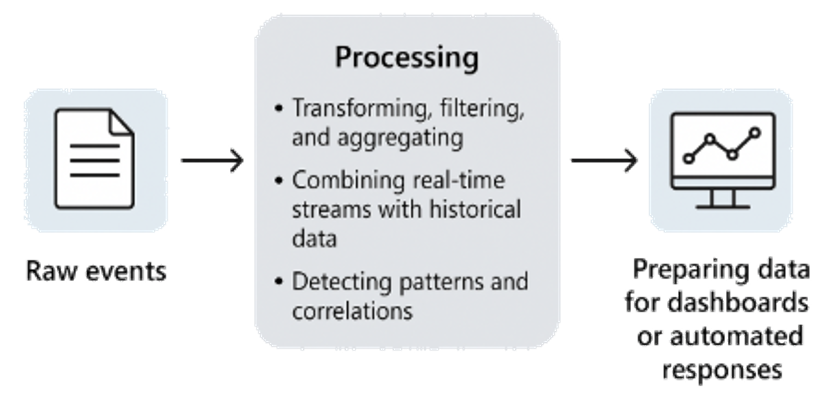
Processing is also where we can do initial aggregation of data into metrics. For example, instead of looking at every single sensor reading individually, you might calculate the average temperature over a 10-second window. Instead of millions of click events, you might group them into counts per user or per product. Aggregation turns individual events into higher-level insights.
Another important aspect is enrichment — adding context to the events. A raw event might tell you that device ID 12345 sent a reading, but without enrichment that ID is meaningless. By joining with reference data — say, a lookup from another stream of data that tells you that device 12345 is a temperature sensor in the Sydney factory — you turn a cryptic event into actionable information. In Fabric, this is often done with KQL queries, which are designed for analyzing high-volume, real-time data and detecting anomalies or unusual patterns.
Processing is also where you start to combine real-time streams with historical data. For example, you might compare the current sensor readings against a baseline from last week, or measure today’s website traffic against the same time yesterday. This blend of now and then is what gives real-time analytics real power — it’s not just seeing what’s happening, but seeing how it compares to what usually happens.
And finally, processing is where you can detect patterns and correlations across events. Maybe a sudden spike in login attempts signals a security attack. Maybe a sequence of machine readings suggests a failure is about to occur. By looking at events together instead of one by one, you can find these bigger insights.
The result of processing is data that’s been cleaned, filtered, enriched, and summarized — in other words, data that’s ready to be consumed. That might mean sending it to a real-time dashboard in Power BI, or triggering an automated response through Activator. Either way, the processing stage is the first step in transforming raw streams into business value.
Learn more about Fabric RTI
If you really want to learn about RTI right now, we have an online on-demand course that you can enrol in, right now. You’ll find it at Mastering Microsoft Fabric Real-Time Intelligence
2026-01-25