
Shortcut: Saving and sharing SQL Server deadlock graphs

In an earlier post, I described how query plans could be saved as .sqlplan file, shared, and loaded again in SQL Server Management Studio (SSMS). It’s also possible to extract them out of SQL Server Profiler or Extended Events Profiler.
This is useful, but the same applies to deadlock graphs. SQL Server 2005 added Deadlock graph as a type of event in SQL Server Profiler. (It’s also part of Extended Events Profiler).
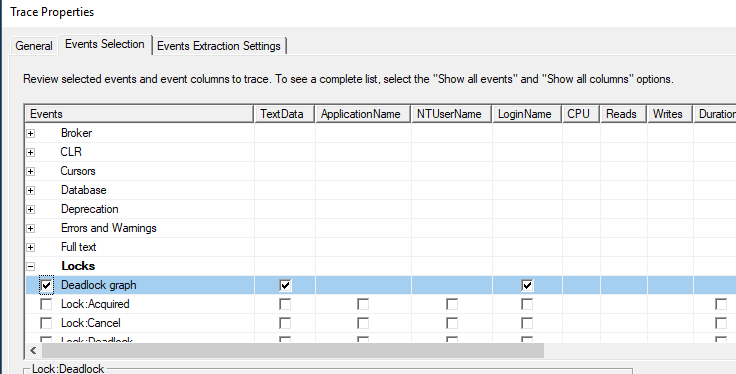
If I open a new trace in Profiler, I can add Deadlock graph to the list of events:
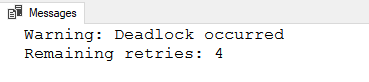
Then when a deadlock occurs, we can see an entry for it in the trace:
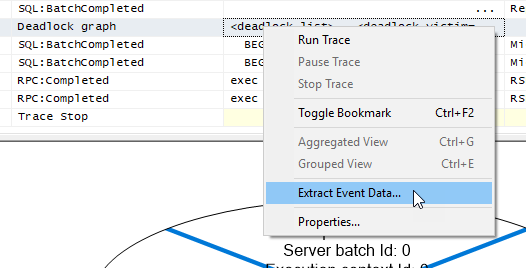
Now if you want to share that with someone else, you can right-click the deadlock graph event and extract the event data:
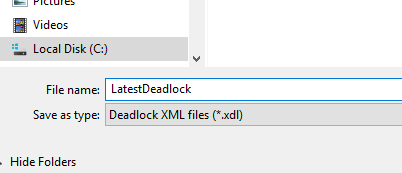
When you do this for a deadlock, the output is saved as a .xdl file extension.
You can then send it to someone else and they can load it in SSMS:
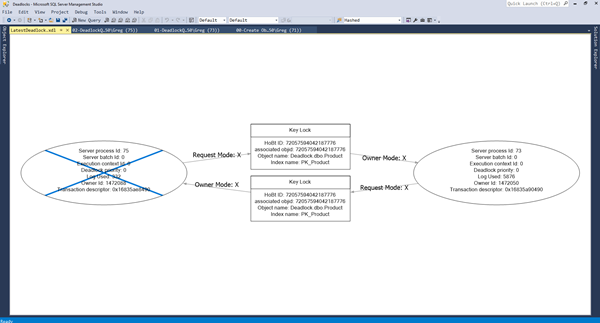
One important thing to note is that a deadlock graph is actually a list of deadlocks, not just one deadlock. When a deadlock graph is opened in SSMS, it only shows the first deadlock in the graph.
2018-12-27