
Shortcut: Viewing and configuring spatial data output in SSMS

SQL Server 2008 added the ability to work with spatial data by the additional of the geometry and geography data types. When they first were added, there was no tools support for working with them, and all we had was direct manipulation of their internal binary storage.
Here’s an example:
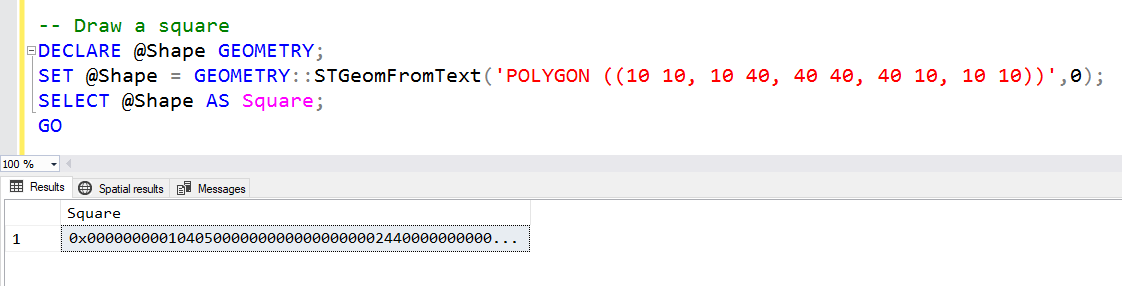
I’ve defined a variable named @Shape of type GEOMETRY. I’ve then assigned a shape to it, based on a polygon formed by a set of points. If you look carefully, you’ll notice that it’s a square.
But when I select the value, what is returned is the internal value of the data type, as a binary string, written in hexadecimal for ease of reading 😊
And at first, that’s all we had. But notice that there is now another results tab:
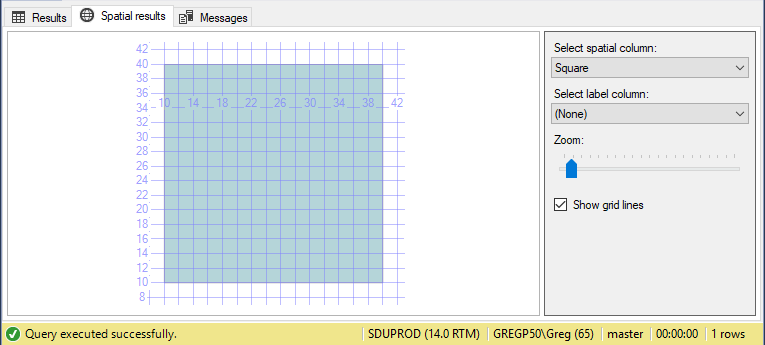
As soon as SSMS sees any spatial data in the results, it adds a tab to try to visualize it. Under the covers, it’s actually the mapping control that Microsoft purchased from Dundas and put into Reporting Services.
On the right hand side, we can pick the column to be displayed, because we might have more than one, and we can overlay a label if another column is holding the label. In this case, let’s modify the query to have two columns, one with the value, one with the label:
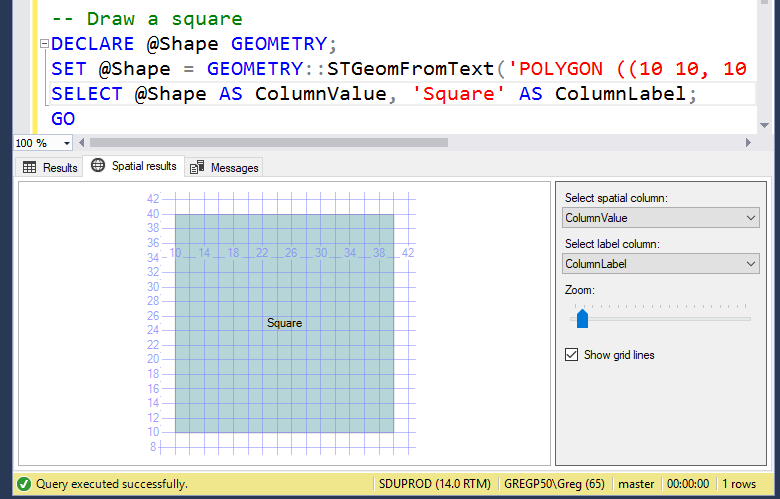
The mapping tool works out where to put the label so it’s somewhere on the image. SQL Server has a function call to try to help with that. (It’s easy for a square, but hard for say a donut).
If more than one row of data is returned, a shape is displayed in a different color for each value. This can lead to some awesome outcomes. Note what happens if we select all of the Application.Countries table from WideWorldImporters, choose the CountryName as the label, and zoom in slightly:
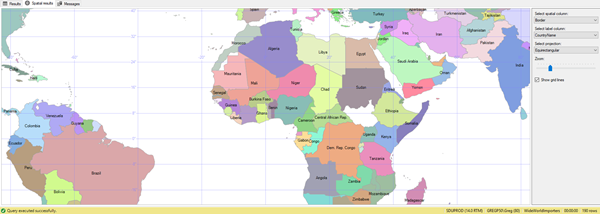
This is an awesome tool for visualizing data.
2018-11-22