SSMS Tips and Tricks 8-3: Using split screens
If you are working with really long script files in SSMS, you might need to work on more than one part of the script at the same time. Perhaps you need to work on a function, and also on the code that calls the function.
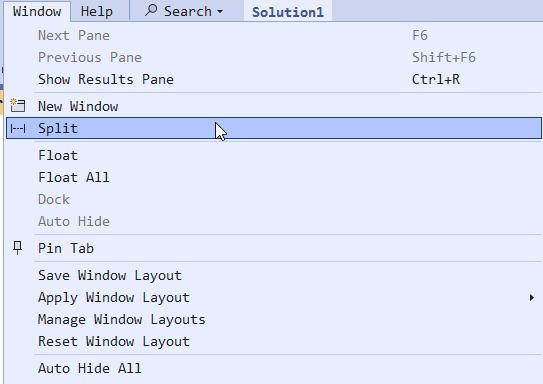
On the Window menu, there is a Split option.
When you first do this, you’ll see a split window with the same query at top and bottom:
2026-01-03