
T-SQL 101: 92 Categorizing output rows by using NTILE
I’ve been talking about the basic window functions in T-SQL and one that’s not well known but is surprisingly useful is NTILE.
I’m not sure on the name but it’s probably short for percentile. I don’t know why they didn’t call it a slightly more meaningful name, but what it says is take the output and break it up into bands or chunks of data.
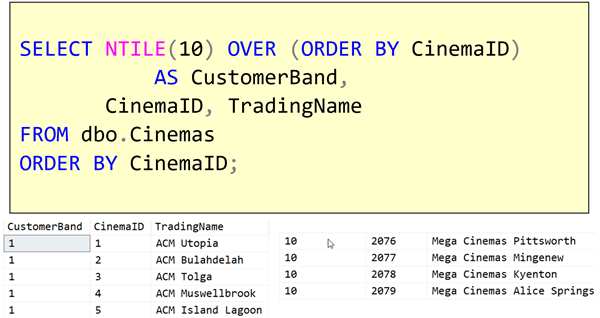
So if I say NTILE(10), that’ll give me a tenth of the rows with a value of 1, another tenth of the rows with a value of 2, and so on.
This is actually really, really useful if you’re trying to do things like populate a graph with the bottom 10%, the next 10% and so on. This function would return you the required tiling for that graph i.e. which band each value needs to go into. In the example, I’ve called it customer band, but I’ve just gone through CinemaID order and so they start all being number one. Then there would have been a tenth of them with number 2. A tenth of them with number 3 and so on, and the end of the list is shown on the right. There the the last ones will have the value 10.
This can be very useful.
Learning T-SQL
It’s worth your while becoming proficient in SQL. If you’d like to learn a lot about T-SQL in a hurry, our Writing T-SQL Queries for SQL Server course is online, on-demand, and low cost.

2021-03-29