
Shortcut: Viewing client statistics in SQL Server Management Studio

While SQL Server is quite fast at executing queries, when you are connecting from a client application like SQL Server Management Studio (SSMS), you might wonder how much time SQL Server spent executing the query, as opposed to how long the communication with the server took.
This type of information is available in the Client Statistics.
Let’s see an example. If I connect to a server in an Azure data center, I’ll have higher latency than for one in my own site. That will affect the wait time for a server response.
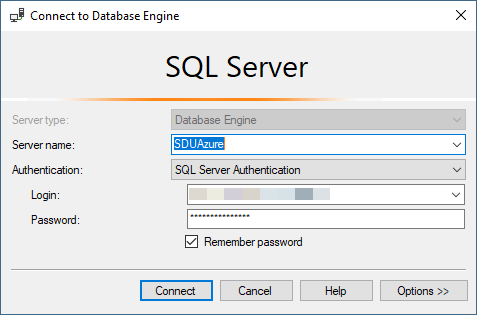
This server is in the Melbourne (Australia South East) data center.
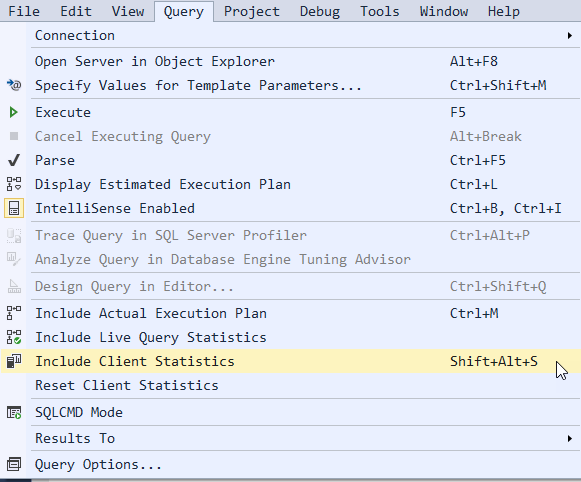
Let’s execute a simple query against it, but before doing so, on the Query menu, choose Include Client Statistics.
I’ll just query the SQL Server version:
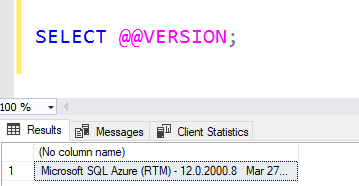
Notice that an extra tab of data is returned.
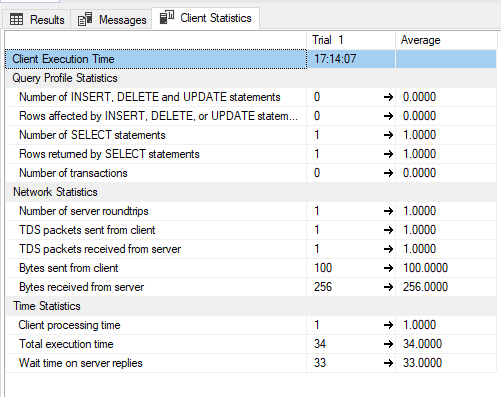
From the bottom section of this tab, we can see where the time was spent. In this case, out of a total of 34 milliseconds for the query, 33 milliseconds was spent waiting for the server.
2018-08-16